The interactive below accompanies this article I wrote for the Washington Post. The article has some other figures, explains the motivation, and provides a less-detailed overview of the methodology than that provided below.
(Drag the vertical line)
Why does this approach work?
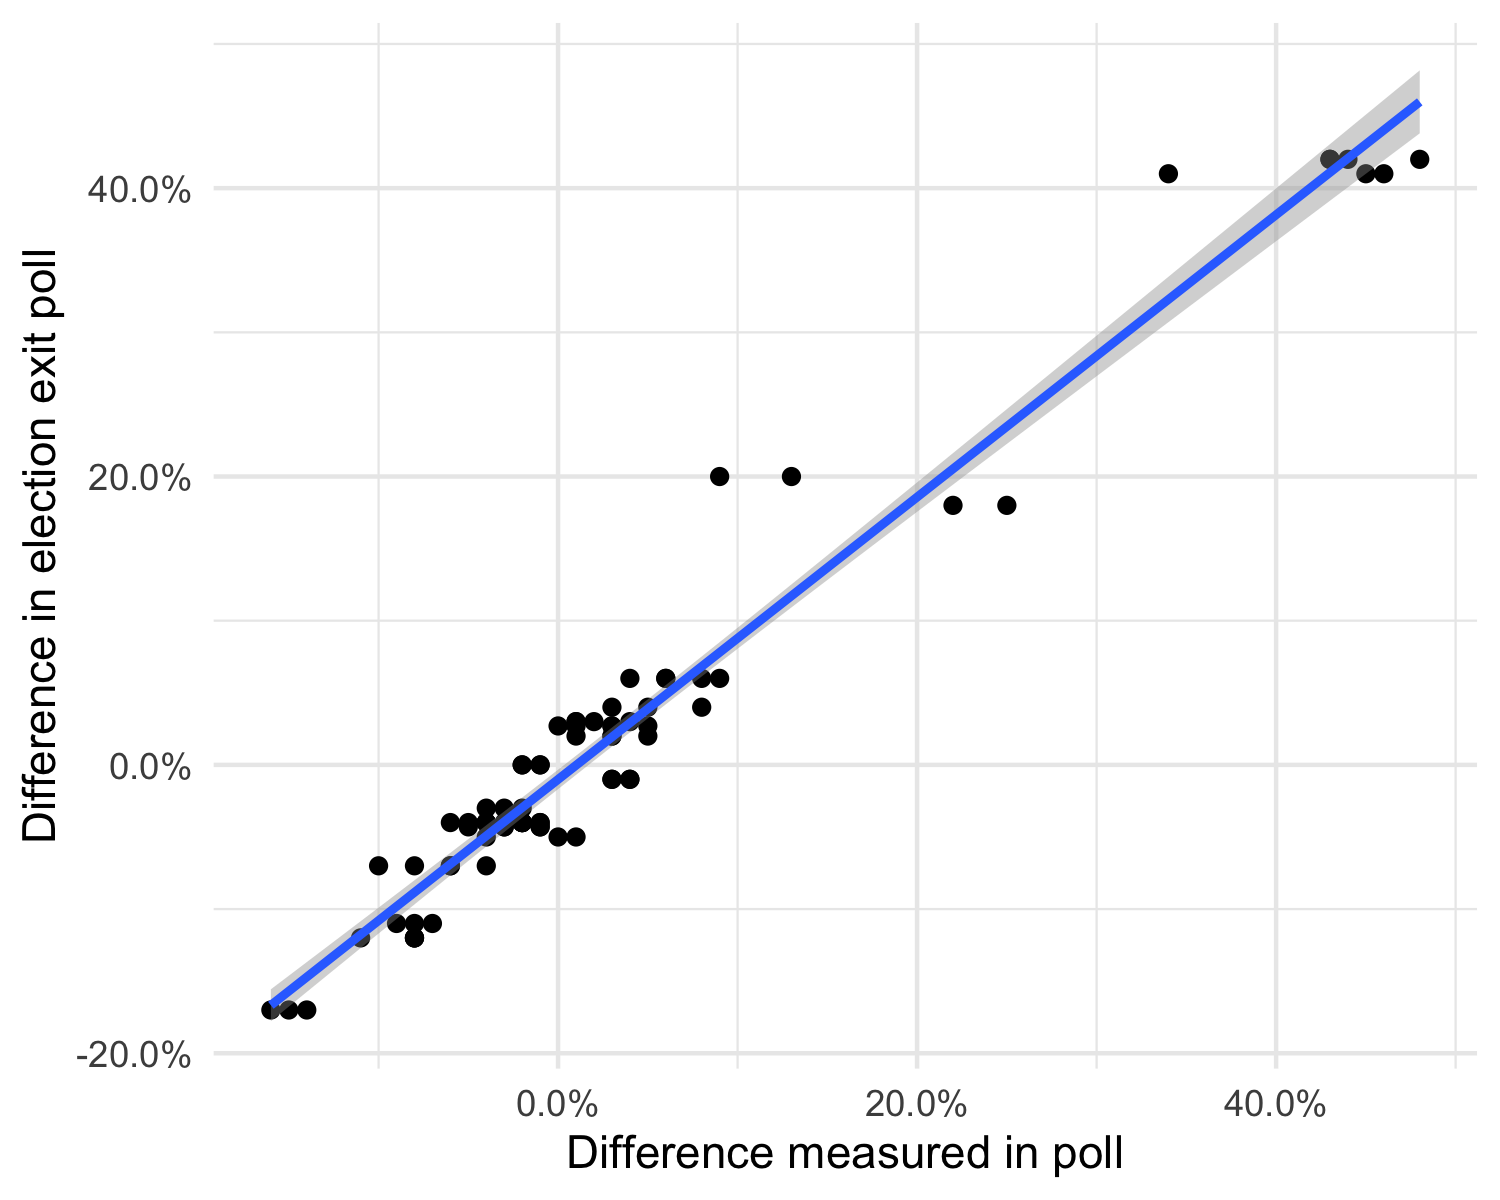
While head-to-head polls are generally not very predictive, the demographic patterns they reveal turn out to be much more durable, as the figure below illustrates. Polled demographic patterns (a candidate’s support in a demographic group, minus their overall support), on the horizontal axis, are compared to actual election reults on the vertical. Polls are shown for presidential elections since 2002, using available Quinnipiac demographic cross tabs, and exit poll results.
Methodology summary
I did some matrix algebra to basically estimate the (linear model) coefficients on each demographic category (white, college-educated, gender, etc.) and their interactions from the poll crosstabs. Ideally these would have been estimated using stratification from a multilevel Bayesian model. Either way, the predictions from this model were used as starting points in the next step.
I used exit poll and CPS microdata to build a synthetic electorate, with vote preferences by each cell (state×demographic) fit using iterative proportional fitting (and initialized to the model predictions above) so that the marginal totals matched state returns and national demographic crosstabs. Then I reweighted to account for 4 years of demographic change, to create a synthetic 2020 electorate.
Then, for each candidate, I computed the difference between the candidate’s support in each demographic group (on the logit scale) and the candidate’s overall support (also on the logit scale). These differences were then differenced again with the Clinton numbers from 2016. Basically we get a number saying how much to shift each demographic group on the logit scale. These shifts are applied again through the iterative proportional fitting algorithm. The national shift is applied in the same way.
To account for error in the polls, I took the within-poll and across-poll error and simulated varying polling numbers by candidate, and then reran the analysis.