On September 28, 2021, the Washington State Redistricting Commission released four plans as starting points for drawing congressional districts. Washington neither gained or lost a seat following the 2020 Census, maintaining its apportionment of 10 seats for this decade.
In Washington, redistricting is done by a five-member non-politician commission. Washington was one of the first states to adopt a commission model for redistricting, in 1983, after decades of court battles. The commission consists of appointees from each of the majority and minority parties in the state House and Senate, along with one non-voting member. The commissioners must work out a redistricting plan, which may be amended by the legislature by a two-thirds vote. Democrats control the state legislature, but do not have a supermajority, making such amendments unlikely.

The four proposed congressional districting plans are shown below. The two Democratic plans generally follow the contours of the 2010 map, while the Republican plans make more significant changes, especially to District 8 (Kim Schrier), which currently runs from the outer-ring Eastside suburbs across the Cascades.
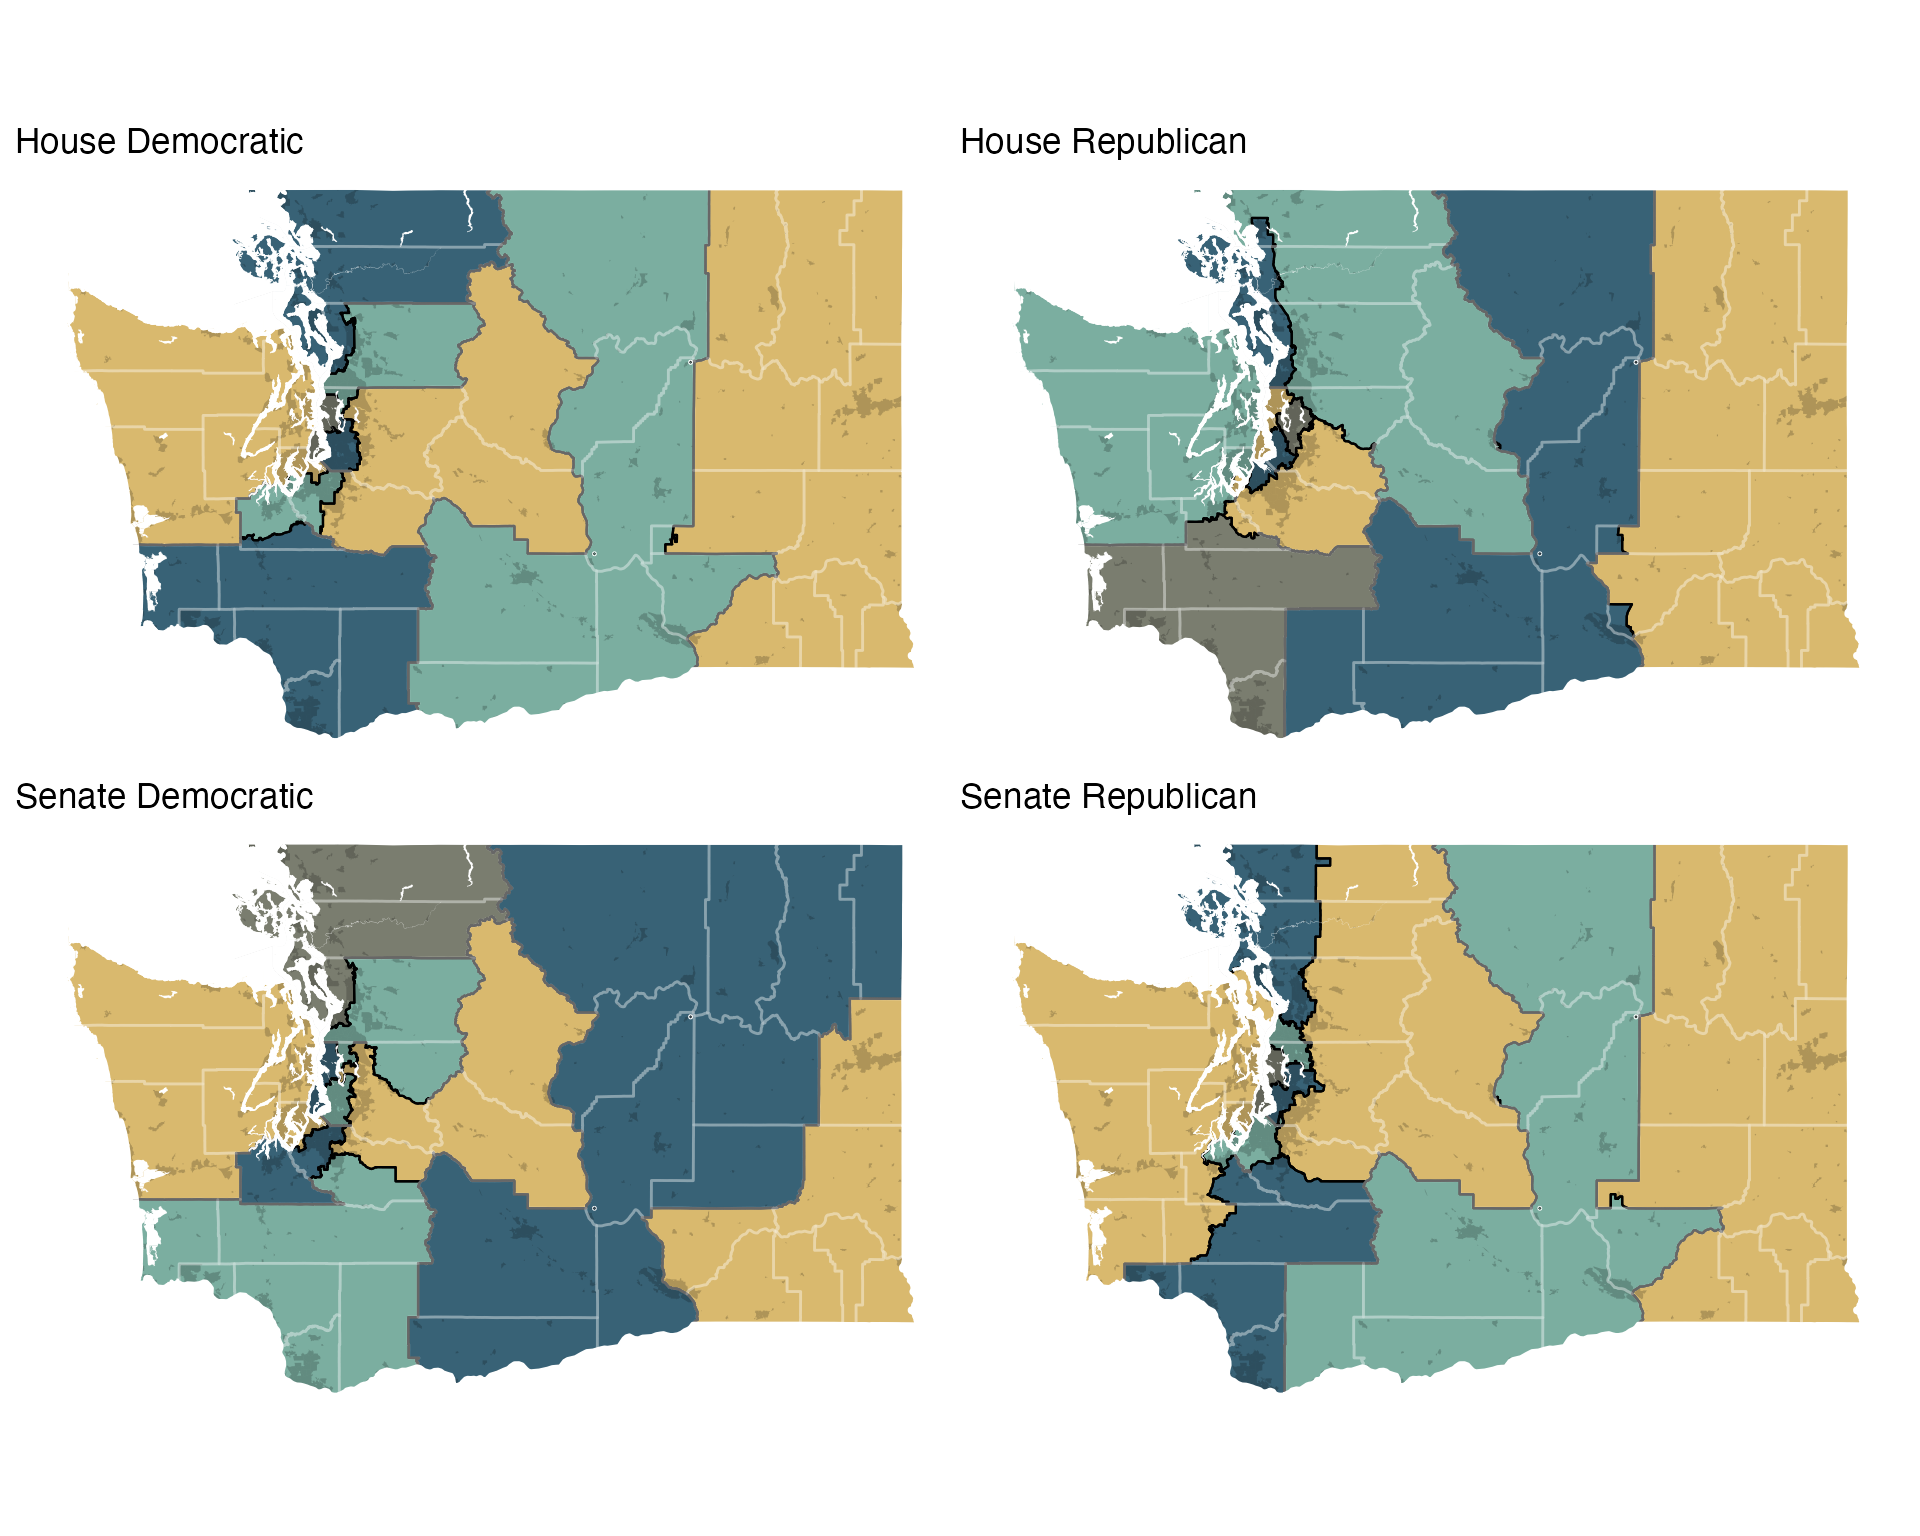
Figure 1: The four congressional districting plans.
Political Features of Both Maps
As with all of our analyses, we compare these proposed plans with a large set of simulated plans, allowing us to understand how they differ from what might be reasonably expected.
These simulated plans follow Washington’s requirements of contiguity and compactness, and generally follow county lines. However, they do not take into account natural boundaries such as Puget Sound or the Cascade mountains, nor city or town boundaries. Additionally, they do not attempt to draw districts which look like the current districts. Staying closer to existing districts, and following geographic boundaries, may lead to qualitatively different districts with different partisan implications.
](washington-prelim-congressional_files/figure-html5/dem-distrs-1.png)
Figure 2: Democratic vote by district for the four plans and for 3,000 alternative plans. Learn more about this plot
The two Democratic plans create 7 safe Democratic seats, while the two Republican plans allow for only 6. The Republican House plan creates an even 5–5 split.
In comparison, the simulated plans align more with the Democratic plans, giving them 7 seats, on average, though with the 7th seat a bit more competitive.
Proportionality and Representativeness
All our plans are given two R.A. Plan Scores, one for proportionality—how close the seats distribution reflects the statewide vote—and one for representativeness—the odds that an average voter is represented by their preferred political party. The scores for Colorado are shown above. The graph below shows the proportionality and representativeness for all of our simulated redistricting plans, and the two proposed plans.
](washington-prelim-congressional_files/figure-html5/prop-repr-1.png)
Figure 3: Proportionality and representativeness for the redistricting plans. Learn more about these measures
The Republican plans are quite proportional–giving them seats closer to their statewide vote share, on average, than would be otherwise expected. The Republican plans are also a bit more representative, though all four plans score well on this measure. This means the average voter is slightly more likely to be represented by a member of their preferred party under the Republican plans than under the Democratic plans.
What would a good plan look like according to these two measures? The Republican House plan actually performs quite well, but has already been criticized as a gerrymander and is unlikely to be enacted. The two maps below are the simulated redistricting plan which scored the combined best on proportionality and representativeness. It has two safe Republican seats, one lean-Republican seat, four safe Democratic seats, and one competitive seat.
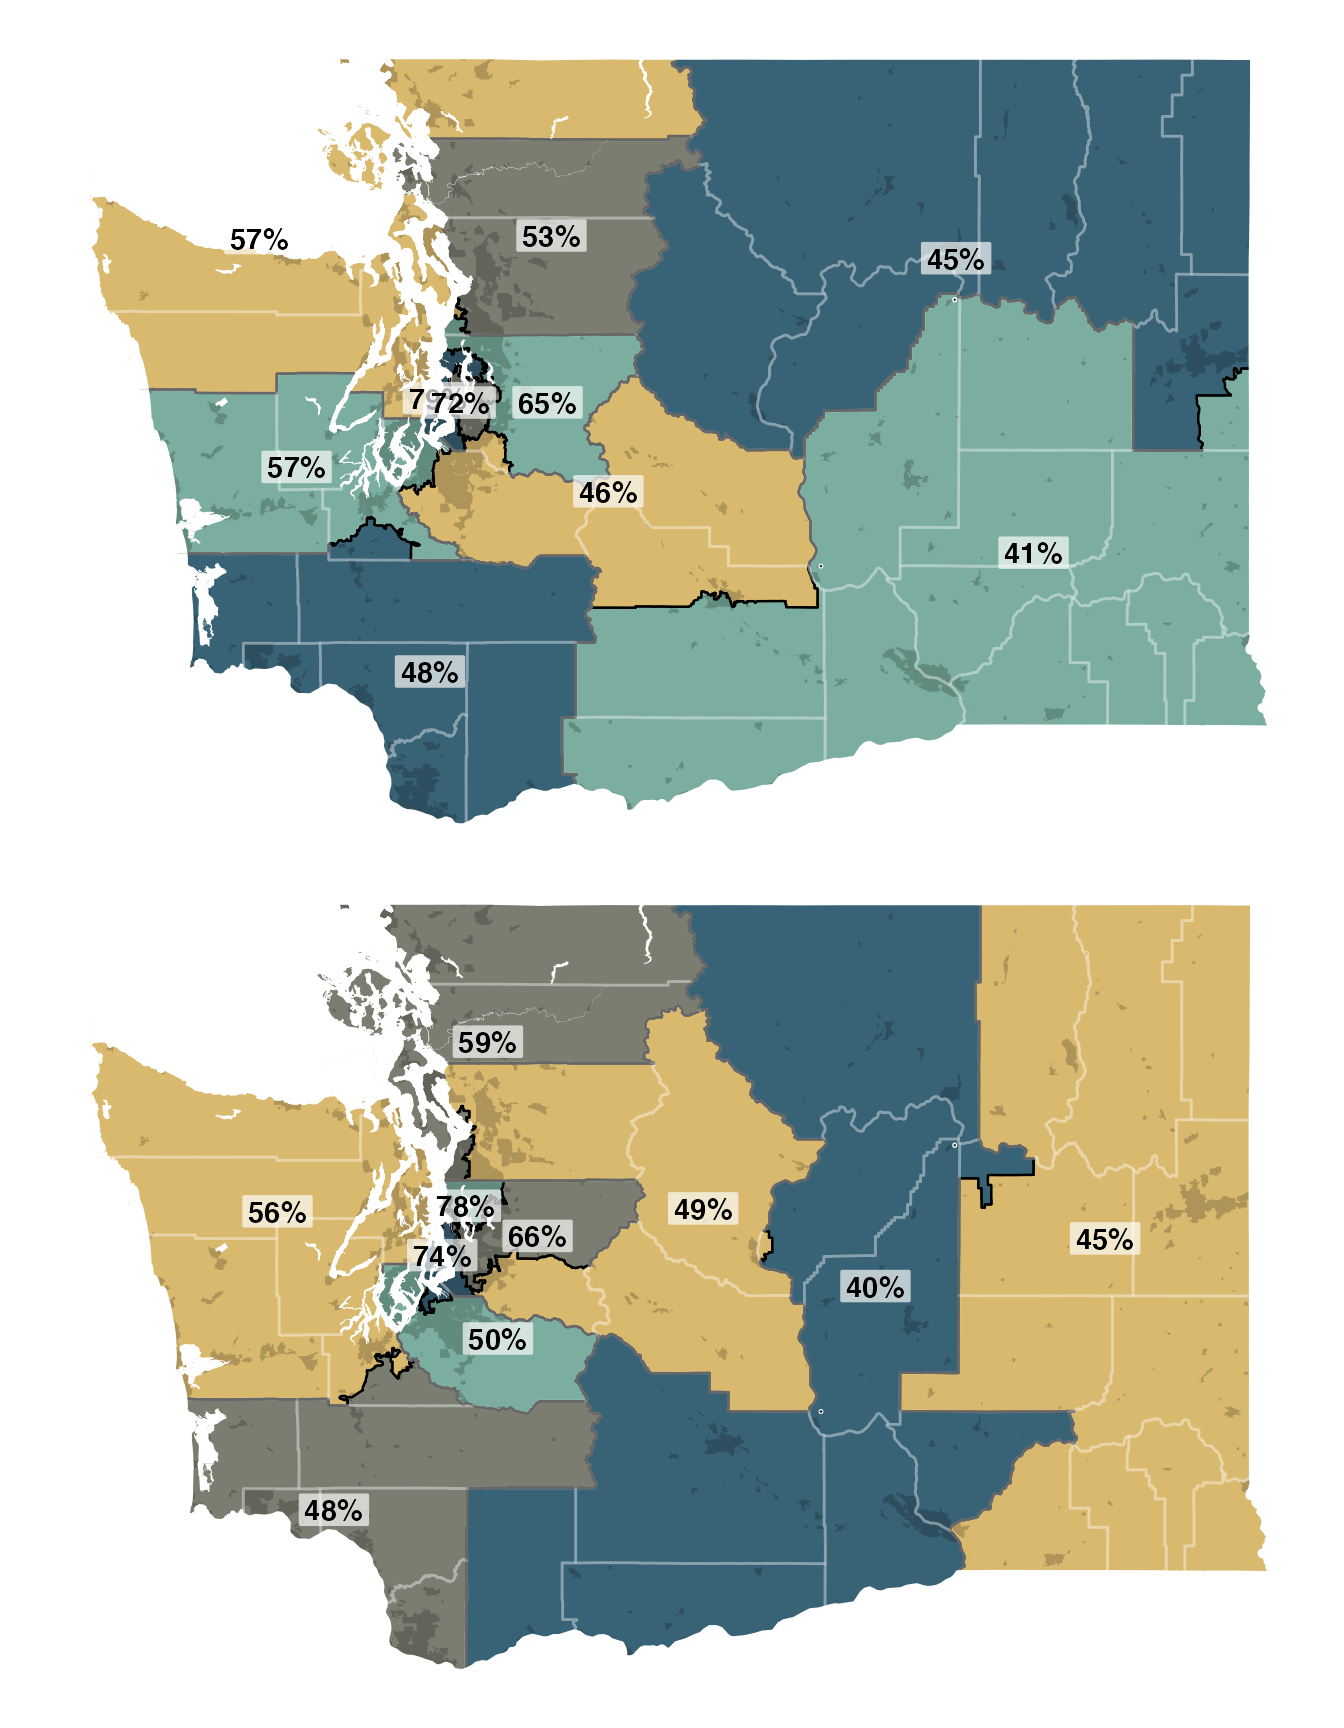
Figure 4: The sampled plans with the best combination of proportionality and representativeness, with Democratic vote shares labelled.